Tag Archives: research

Analyzing Food Nutrients and Comparing Food Guides

Teacher Note: Depending on the length of class time available, this lesson may take 2-3 sessions to complete.

Learning Outcome:

Explain the relationship between cells, tissues, organs, and organ systems

CONNECT

Goals:
To understand:
a) how nutrients are essential to the body
b) how cooking processes transform the nutritional value of the food we eat.

Task: Students will select a natural food item, compare it with a cooked/processed version of the same item, and demonstrate the nutritional impact on the body.

Key vocabulary to discuss: nutrients, protein, fats, saturated fats, unsaturated fats, trans fats

omega-3 fatty acids, cholesterol, minerals, vitamins, carbohydrates.(Definitions)

Activate Prior Knowledge: Ask the students as a class whether they think they eat properly. Have students write down yes or no on a scrap piece of paper and have them put their answers into a bin so you can record the results on the board in an anonymous way.

Review with the class the categories and contents of the Canada Food Guide. In partners, discuss the food guide. Ask what two areas the students feel they are most likely to eat the recommended amounts. Have students share the information with the class and graph the results on the board using a food grid.

Question: What are the five different types of nutrients one can obtain from food? Students discuss their ideas with a partner and report back to the class.

PROCESS

Using the McGraw-Hill Ryerson textbook BC Science 8 (pages 64-69) or other classroom/internet resources, small groups investigate the five different types of nutrients obtained by food. Small groups should be 3-4 students. Some groups will have the same topic. Topics include: carbohydrates, proteins, fats, minerals and vitamins. Students must identify the function of the nutrient as well as examples from the food guide. Use the nutrient wheel to track their thinking. Students must share information with the class allowing others to complete their nutrient wheels.

In their same small groups, distribute copies of the Coastal B.C. Native Food Guide or food guides that reflect other cultures.   Students discuss what foods are not included in the Canada Food Guide and add examples to their nutrient wheel.

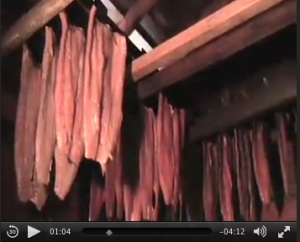
Video: Students view the movie.

Guiding Questions: Do students think the nutrients will change when the fish is smoked from when it is raw? Why is smoking fish important/necessary?

Reminder: It is important to stop throughout the video and give students (A/B partners) opportunity to talk or respond to the video.

Videos

Screen Shot 2015-05-04 at 11.18.48 AM

(Video Length: 6 mins)


The smoked fish in the video is Chum, but Chinook is close enough for comparison. Print out a nutrition guide for raw Chinook and smoked Chinook to compare. Students in partners or their previous small groups compare the information and discuss key differences.

Raw Chinook Salmon Nutrition Data

Smoked Chinook Salmon Nutrition Data

TRANSFORM

Students, in partners, will select a natural food item, compare it with a cooked/processed version of the same item, and demonstrate the nutritional impact on the body. An example may be a potato and McDonald’s french fries. Students can use the Nutrition Data Website to select and research their food information. Criteria should be developed with the class to determine the depth and completeness of the components required. How students present their learning can be up to the teacher or students. Examples for demonstration include: posters, debate – one partner argues for the potato and one argues for the french fries, t-chart, video, radio/TV commercial, written report, etc.

REFLECT

Students can reflect on their own eating habits and set personal goals for healthier eating choices.

Extend learning or next lesson

Students can make their own personalized food guide. Students could also find other foods they commonly eat on the Nutrition Data Website and analyze what these foods give them for nutrients, or create their own food list for a 24 hour period and analyze whether they got enough or too much of the different nutrients.

Aboriginal Populations in Canada and Guyana

Comparing the Standards of Living for Aboriginal Populations in Canada and Guyana

Teacher Note: Depending on the length of class time available, this lesson may take 2-3 sessions to complete.

Learning Outcomes

Students will:

  • demonstrate knowledge of the challenges faced by Aboriginal people in Canada during the 20th century.
  • compare Canada’s standard of living with those of developing countries, with reference to poverty and key indicators of human development.

Steps to the Unit

  1. Complete a Jigsaw Instructional Activity on three articles discussing how Canadian government policy and legislation have impacted Canadian Aboriginal populations.
  2. Complete a What’s Important and Why organizer on an article discussing gold mining in Guyana.
  3. Discuss key vocabulary.
  4. Watch a video and complete a Graphic Organizer.
  5. Compare the key indicators of human development of Canada and Guyana and present conclusions using graphs and text.
  6. Reflect on new understanding.

CONNECT

Goals:

  • Students will research some key legislation and overall public opinion regarding the standard of living for Aboriginals in Canada.
  • Students will research key indicators of human development for Canada and the South American country of Guyana.
  • Students will compare and graph key indicators of human development for Canada and the South American country of Guyana.

Task:

Students will create a presentation using text and series of graphs comparing the key economic indicators of Canada and Guyana.

Activate Prior Knowledge:

Standards of living are not only measured in incomes people earn. The quality of life includes such things as health, levels of nutrition, life expectancy, literacy, and the status of women and children. The quality of life also depends on freedom of expression, economic freedom, and the right to a safe and clean environment.

(Cranny, M., Moles, G. (2001). Counterpoints – Exploring Canadian Issues (p. 343-345). Toronto: Pearson Education Canada Inc.)

Although Canada ranks high in the United Nations Human Development Index (4th out of 177 countries), a significant portion of Canada’s population (3.8 % in the 2006 Canadian census), the Canadian Aboriginal population, experiences living conditions similar to those in Third World countries such as Guyana.

For information on the Aboriginal experience in Canada, teachers print out and distribute the following articles:

  1. The Landscape Public Opinion on Aboriginal and Northern Issues
  2. Poverty on Aboriginal Reserves in Canada

Students read articles independently, or in A/B partners, and look for the key ideas. Once students have completed reading the articles, teachers brainstorm the key ideas from the articles on the board.

———————

There are many reasons attributed to the lower standards of living for Canada’s Aboriginal populations. Many of them can be attributed to federal policies and legislation that govern Aboriginal life in Canada. To increase student understanding of these policies and legislation, teachers print off the following three articles:

(Reed, K., & Quinlan, D. (1999). Aboriginal Peoples: Building for the Future (p. 44-49). Toronto: Oxford University Press Canada.)

Students break into groups of three and teachers distribute the articles using a Jigsaw format. (Note: Depending on the size of class, expert groups should be no larger than 4-5 students.)

Predict:

Given the previous information about the standards of living for Aboriginal people in Canada, students make predictions on the standard of living for people living in Guyana. Will they be similar to the Canadian Aboriginal experience? Different?

The Aboriginal populations of Guyana in South America have also experienced hardship as a result of governmental and corporate policies. One example is the effects of corporate mining practices in Guyana and the Guyana region of Venezuela. Teachers print out and distribute the article Gold and Native Rights in the Guyana region of Venezuela. Students form A/B partners and complete a What’s Important and Why organizer for the article.

Question:

What are the students wondering about how Aboriginal people in Canada and Guyana have been affected by government and corporate policies?

PROCESS

Video Guidelines:

Before viewing the video, students need to understand the meaning of the following terms.

Key vocabulary to discuss: colonization, diabetes, displacement, indigenous, land claim, parallel. (Definitions)

Students watch the following video and track their thinking using the Graphic Organizer. Students should try to identify some key ideas of the Aboriginal experience in Canada and Guyana.

Videos

Screen Shot 2015-03-02 at 9.46.35 AM (Video Length: 6 mins)

TRANSFORM

Student groups now research the facts and figures and create a graph, or series of graphs, comparing the following key indicators of human development in Canada and Guyana:

  • life expectancy
  • infant mortality rate
  • literacy rate
  • GDP/GDP per capita
  • energy/communications/transportation

(Note: With regards to the graph formats, teachers and students should discuss what type of graph would be most effective when comparing data. (i.e. bar graphs, pie charts))

Once the graphs are complete, students create a final presentation which displays both the graphs and their conclusions which they have drawn from the country data. Possible formats for the final presentation include:

  • Written report on letter size paper, complete with title page.
  • Graphs and conclusions assembled and presented on large poster paper.
  • Powerpoint presentation.

REFLECT

On the back of their graphic organizers, students write at least two new ideas or questions they have regarding Canada’s standard of living when compared with other countries. How has their thinking changed?

Extend Learning or Next Lesson

Suggestions to extend student learning include:

  • Students research other global indigenous populations and their efforts to preserve their culture and way of life.
  • Students compare Canada with another country, from either the developed world or Third World, using graphs and text and present their findings to the class.
  • Students choose one specific Third World country and research the facts, figures, and economic indicators of that specific country – culminating in a final report or presentation to the class.
  • Students conduct a ‘Mini United Nations’ session in class, with student groups researching and representing different United Nations member countries.