
Comparing the Standards of Living for Aboriginal Populations in Canada and Guyana
Teacher Note: Depending on the length of class time available, this lesson may take 2-3 sessions to complete.
Learning Outcomes
Students will:
- demonstrate knowledge of the challenges faced by Aboriginal people in Canada during the 20th century.
- compare Canada’s standard of living with those of developing countries, with reference to poverty and key indicators of human development.
Steps to the Unit
- Complete a Jigsaw Instructional Activity on three articles discussing how Canadian government policy and legislation have impacted Canadian Aboriginal populations.
- Complete a Graphic Organizer.
- Compare the key indicators of human development of Canada and Guyana and present conclusions using graphs and text.
- Reflect on new understanding.
CONNECT
Goals:
- Students will research some key legislation and overall public opinion regarding the standard of living for Aboriginals in Canada.
- Students will research key indicators of human development for Canada and the South American country of Guyana.
- Students will compare and graph key indicators of human development for Canada and the South American country of Guyana.
Task:
Students will create a presentation using text and series of graphs comparing the key economic indicators of Canada and Guyana.
Activate Prior Knowledge:
Standards of living are not only measured in incomes people earn. The quality of life includes such things as health, levels of nutrition, life expectancy, literacy, and the status of women and children. The quality of life also depends on freedom of expression, economic freedom, and the right to a safe and clean environment.
(Cranny, M., Moles, G. (2001). Counterpoints – Exploring Canadian Issues (p. 343-345). Toronto: Pearson Education Canada Inc.)
Although Canada ranks high in the United Nations Human Development Index (4th out of 177 countries), a significant portion of Canada’s population (3.8 % in the 2006 Canadian census), the Canadian Aboriginal population, experiences living conditions similar to those in Third World countries such as Guyana.
For information on the Aboriginal experience in Canada, teachers print out and distribute the following articles:
(Reed, K., & Quinlan, D. (1999). Aboriginal Peoples: Building for the Future (p. 44-49). Toronto: Oxford University Press Canada.)
Students break into groups of three and teachers distribute the articles using a Jigsaw format. For more information on conducting a Jigsaw learning activity, please visit the following link on the Jigsaw Instructional Strategy.
(Note: Depending on the size of class, expert groups should be no larger than 4-5 students.)
Predict:
Given the previous information about the standards of living for Aboriginal people in Canada, students make predictions on the standard of living for people living in Guyana. Will they be similar to the Canadian Aboriginal experience? Different?
The Aboriginal populations of Guyana in South America have also experienced hardship as a result of governmental and corporate policies. One example is the effects of corporate mining practices in Guyana and the Guyana region of Venezuela. Teachers print out and distribute the article What’s Important and Why organizer for the article.
Question:
What are the students wondering about how Aboriginal people in Canada and Guyana have been affected by government and corporate policies?
PROCESS
Video Guidelines:
Before viewing the video, students need to understand the meaning of the following terms.
Key vocabulary to discuss: colonization, diabetes, displacement, indigenous, land claim, parallel. (Definitions)
Students watch the following video and track their thinking using the Graphic Organizer. Students should try to identify some key ideas of the Aboriginal experience in Canada and Guyana.
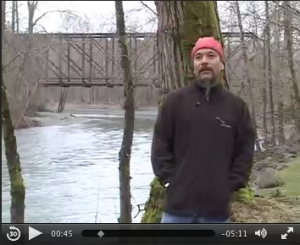
Click above to view video in Mac OSX (Quicktime)
(Video Length: 6 mins)
TRANSFORM
Teachers print off the information located on the Encarta© website and distribute the sheets to students in A/B partners.
Student groups now research the facts and figures and create a graph, or series of graphs, comparing the following key indicators of human development in Canada and Guyana:
- life expectancy
- infant mortality rate
- literacy rate
- GDP/GDP per capita
- energy/communications/transportation
(Note: With regards to the graph formats, teachers and students should discuss what type of graph would be most effective when comparing data. (i.e. bar graphs, pie charts))
Once the graphs are complete, students create a final presentation which displays both the graphs and their conclusions which they have drawn from the country data. Possible formats for the final presentation include:
- Written report on letter size paper, complete with title page.
- Graphs and conclusions assembled and presented on large poster paper.
- Powerpoint presentation.
(Note: The data presented in the Canada Facts and Figures is data collected for the entire country as a whole and not specifically for Canada’s Aboriginal populations. Students should consider the following question:
Do these facts and figures truly reflect the standards of living for Aboriginal populations in Canada?)
REFLECT
On the back of their graphic organizers, students write at least two new ideas or questions they have regarding Canada’s standard of living when compared with other countries. How has their thinking changed?
Extend Learning or Next Lesson
Suggestions to extend student learning include:
- Students research other global indigenous populations and their efforts to preserve their culture and way of life. One example is the Toba people of Argentina. Click on the following link to listen to a CBC Radio documentary entitled Where the Future has Never Arrived.
- Students compare Canada with another country, from either the developed world or Third World, using graphs and text and present their findings to the class.
- Students choose one specific Third World country and research the facts, figures, and economic indicators of that specific country – culminating in a final report or presentation to the class.
- Students conduct a ‘Mini United Nations’ session in class, with student groups researching and representing different United Nations member countries.